Snow Globe Data Visualization
Graphic Design 2
Spring 2025
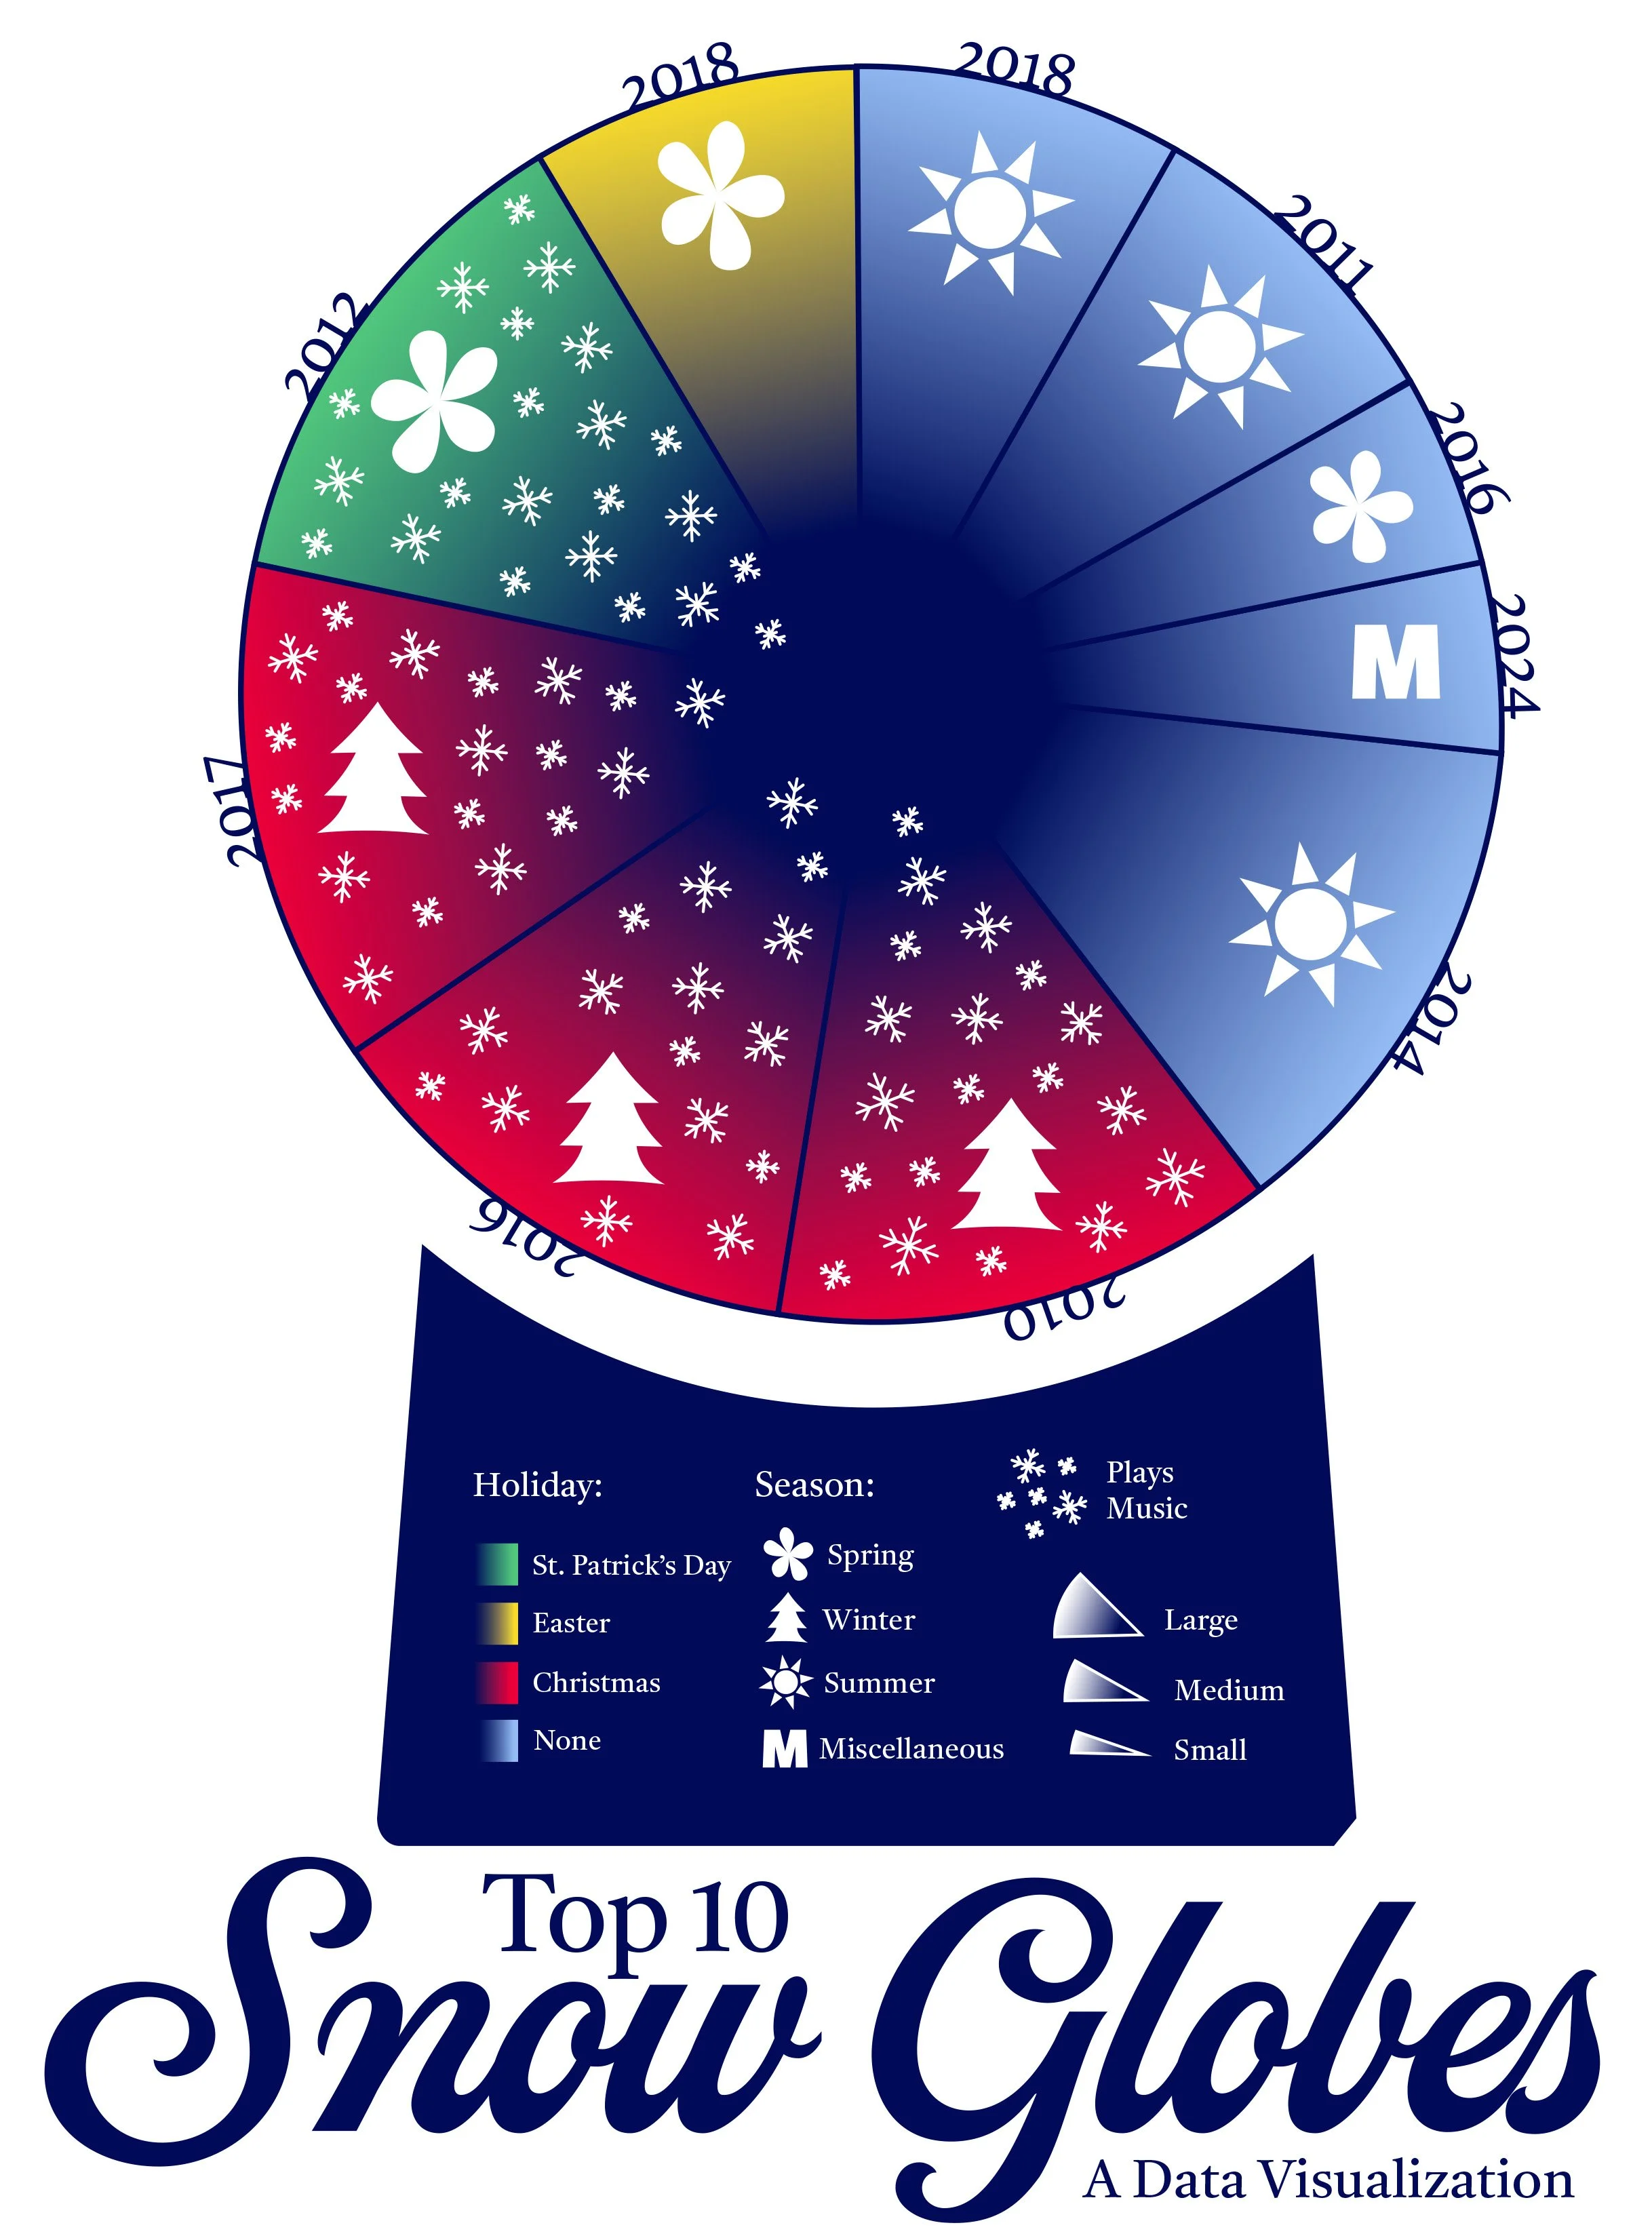
The goal of this project was to create a data visualization that represents a collection. I chose to explore my top 10 collected snow globes, each holding unique stories.
The following is a compilation of my research, conceptual development, and final data visualization work.
Collecting & Understanding Data
The first step of my process was gathering and analyzing data to determine the key characteristics to highlight in my infographic.
I documented my collection in Sheets, identifying five main attributes to visualize. This approach allowed me to establish a foundation for the design of my visualization.


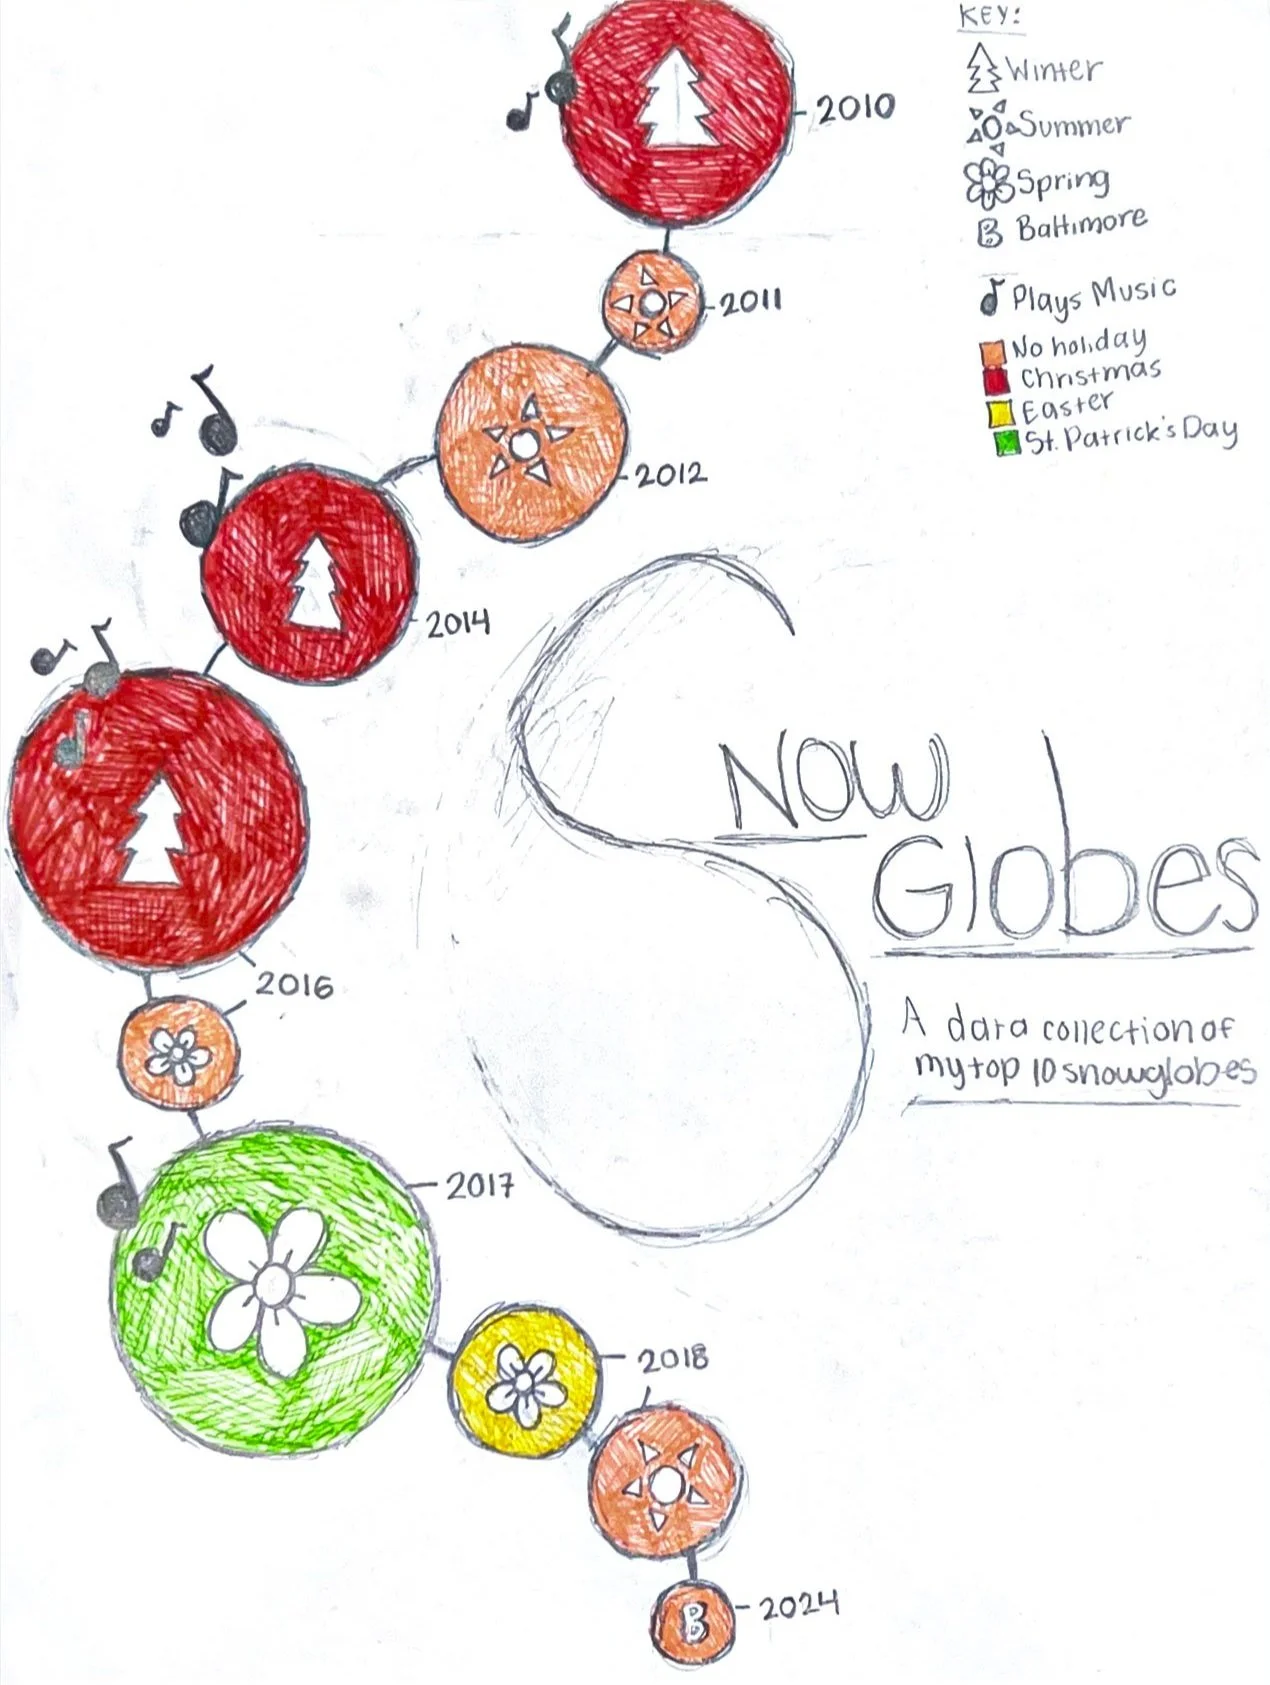
Sketching
My next step was to create ten analog sketches, exploring different ways to visually represent five attributes of my snow globe collection. After evaluating, I chose my strongest idea to refine.


Focus Sketch